
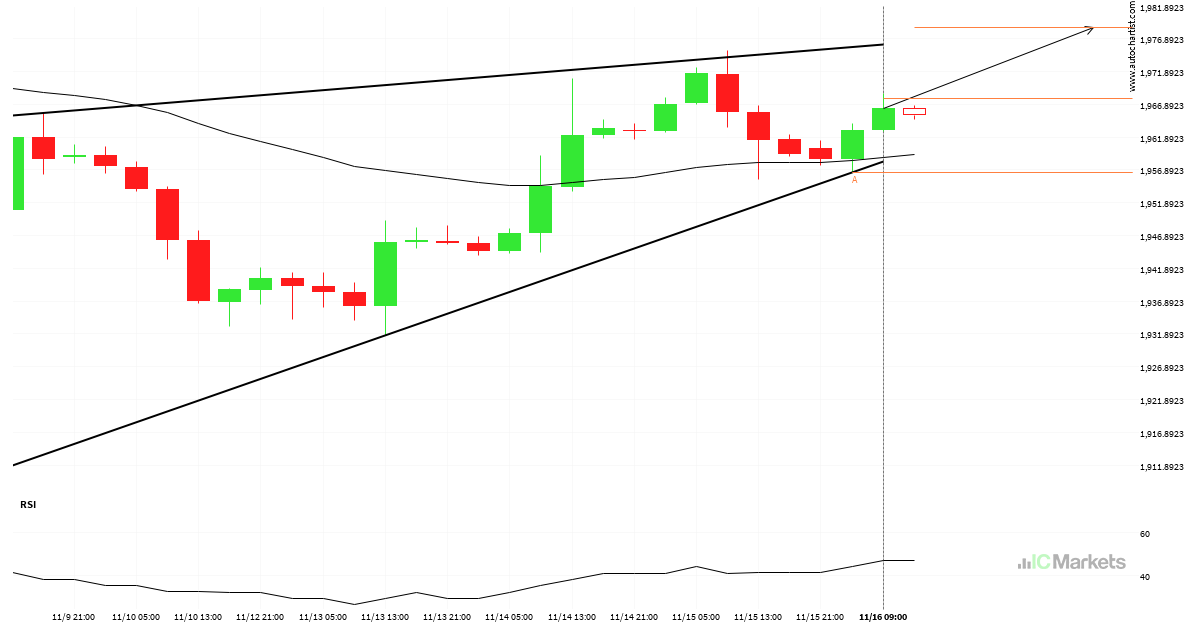
A potential bullish movement on GOLD
GOLD is moving towards a resistance line. Because we have seen it retrace from this line before, we could see either a break through this line, or a rebound back to current levels. It has touched this line numerous times in the last 8 days and may test it again within the next 2 days.
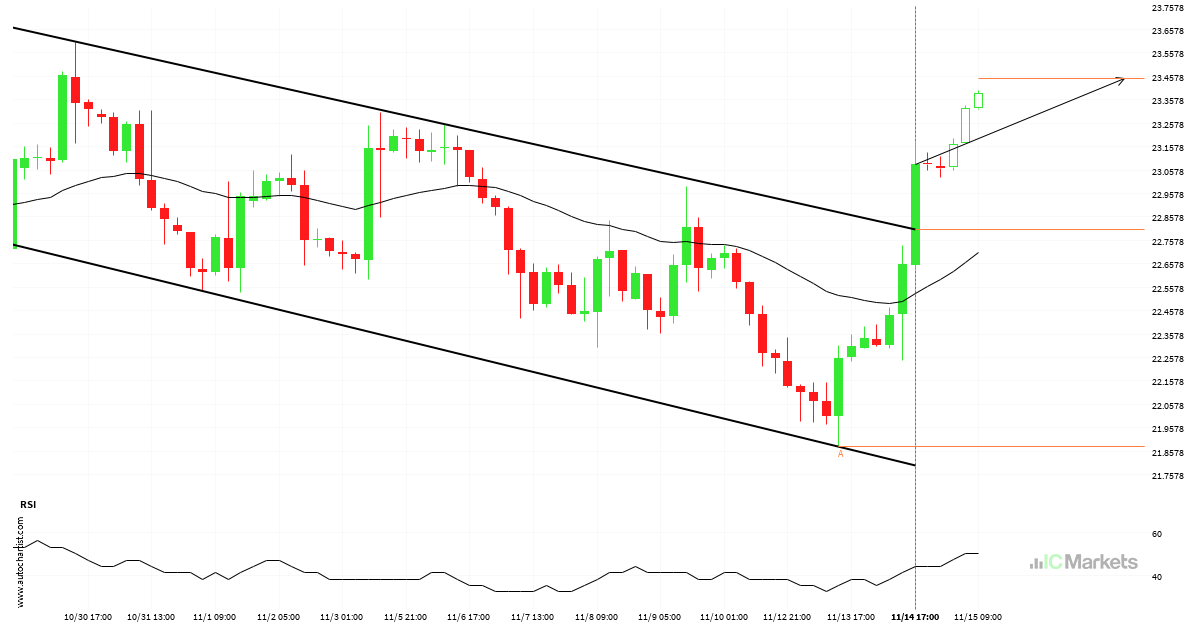
SILVER breakout through resistance
SILVER has broken through a resistance line of a Channel Down and suggests a possible movement to 23.4481 within the next 3 days. It has tested this line in the past, so one should probably wait for a confirmation of this breakout before taking action. If the breakout doesn’t confirm, we could see a retracement […]
Either a rebound or a breakout imminent on SILVER
SILVER is trapped in a Channel Down formation, implying that a breakout is Imminent. This is a great trade-setup for both trend and swing traders. It is now approaching a support line that has been tested in the past. Divergence opportunists may be very optimistic about a possible breakout and this may be the start […]
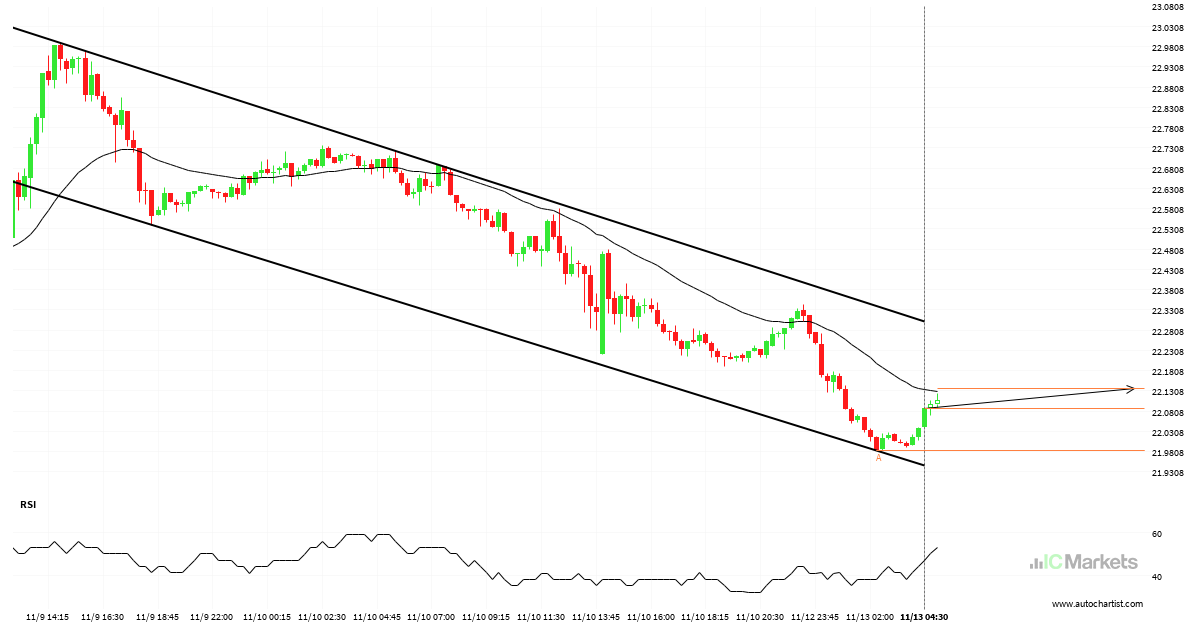
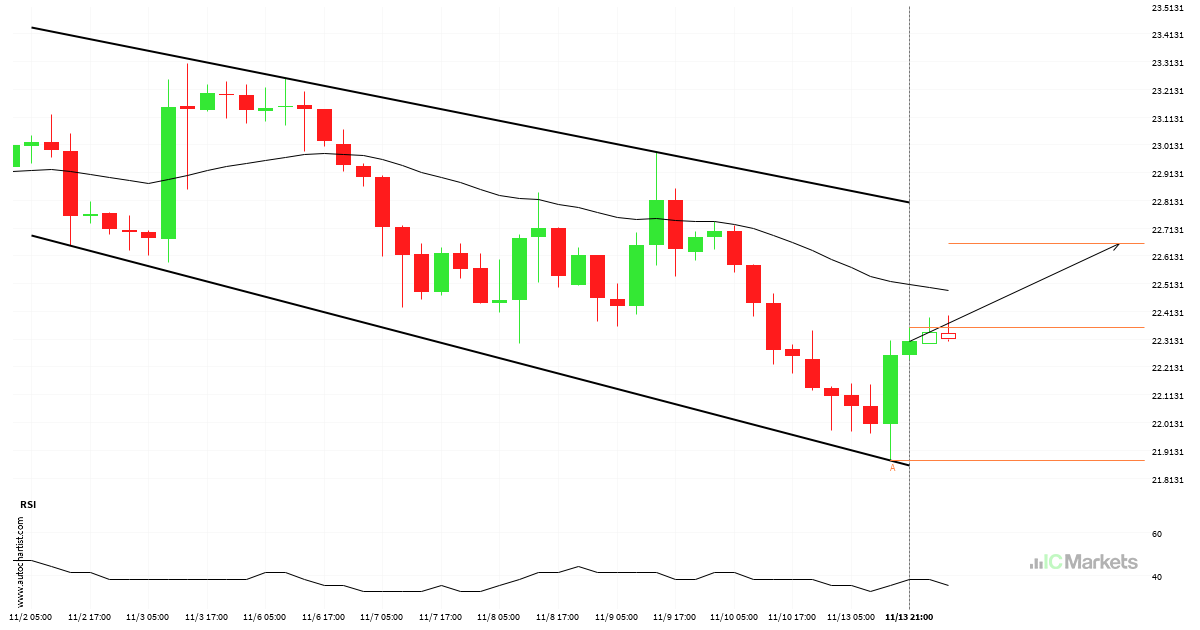
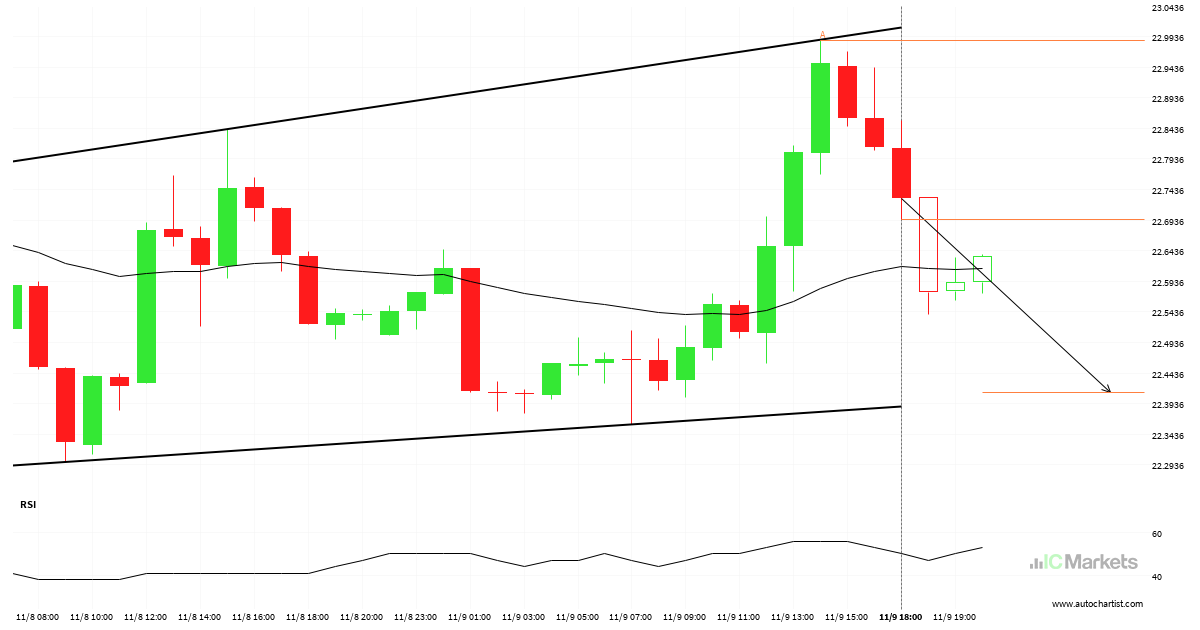
A potential bullish movement on SILVER
Emerging Channel Down pattern in its final wave was identified on the SILVER 15 Minutes chart. After a strong bullish run, we find SILVER heading towards the upper triangle line with a possible resistance at 22.1369. If the resistance shows to hold, the Channel Down pattern suggests a rebound back towards current levels.
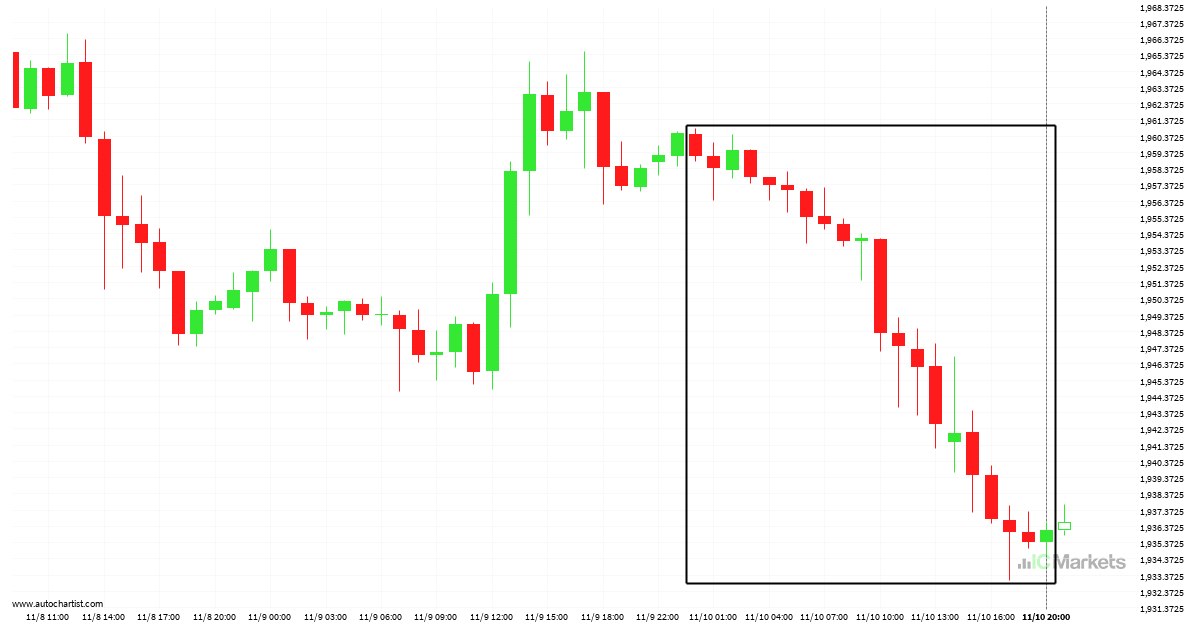
GOLD running downward for the last 20 hours
GOLD has moved lower by 1.17% from 1959.14 to 1936.13 in the last 20 hours.
A potential bearish movement on SILVER
An emerging Channel Up has been detected on SILVER on the 1 hour chart. There is a possible move towards 22.4116 next few candles. Once reaching resistance it may continue its bearish run or reverse back to current price levels.
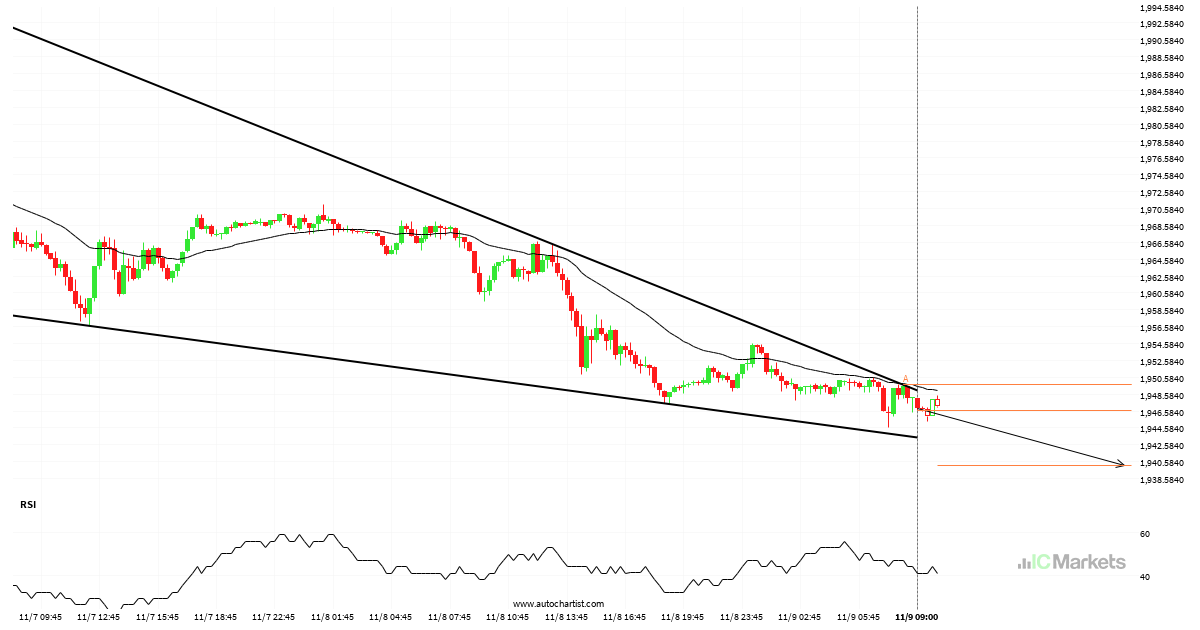
Should we expect a breakout or a rebound on GOLD?
GOLD was identified at around 1946.68 having recently rebounded of the resistance on the 15 Minutes data interval. Ultimately, the price action of the stock has formed a Falling Wedge pattern. This squeeze may increases the chances of a strong breakout. The projected movement will potentially take the price to around the 1940.1800 level.
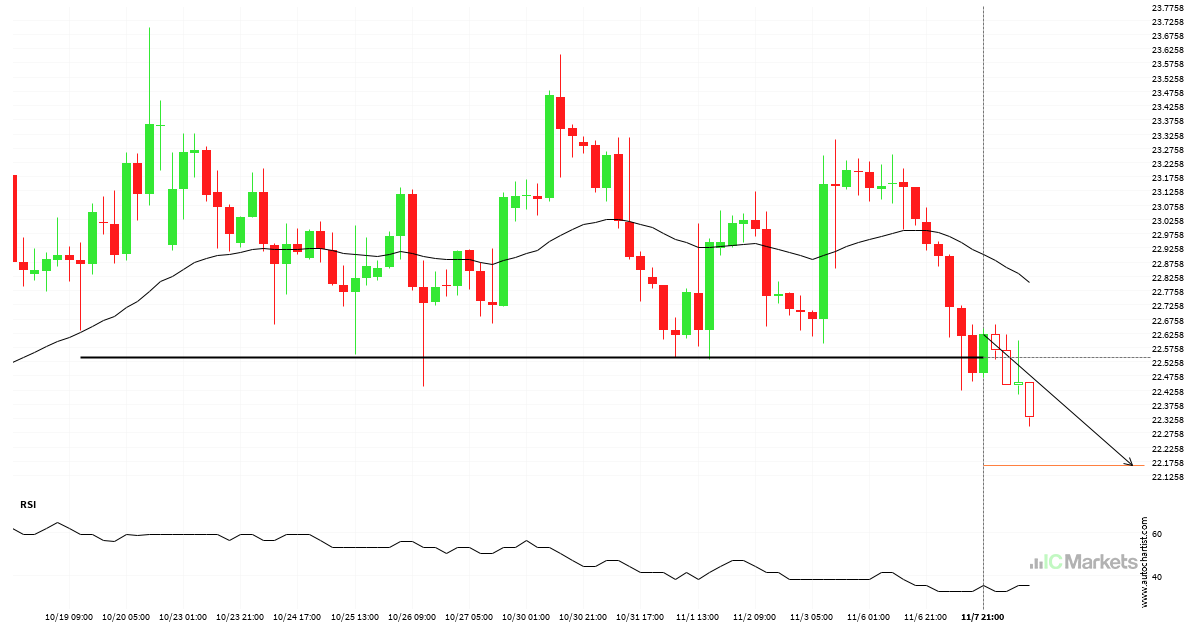
Should we expect a bearish trend on SILVER?
A strong support level has been breached at 22.5420 on the 4 hour SILVER chart. Technical Analysis theory forecasts a movement to 22.1623 in the next 3 days.
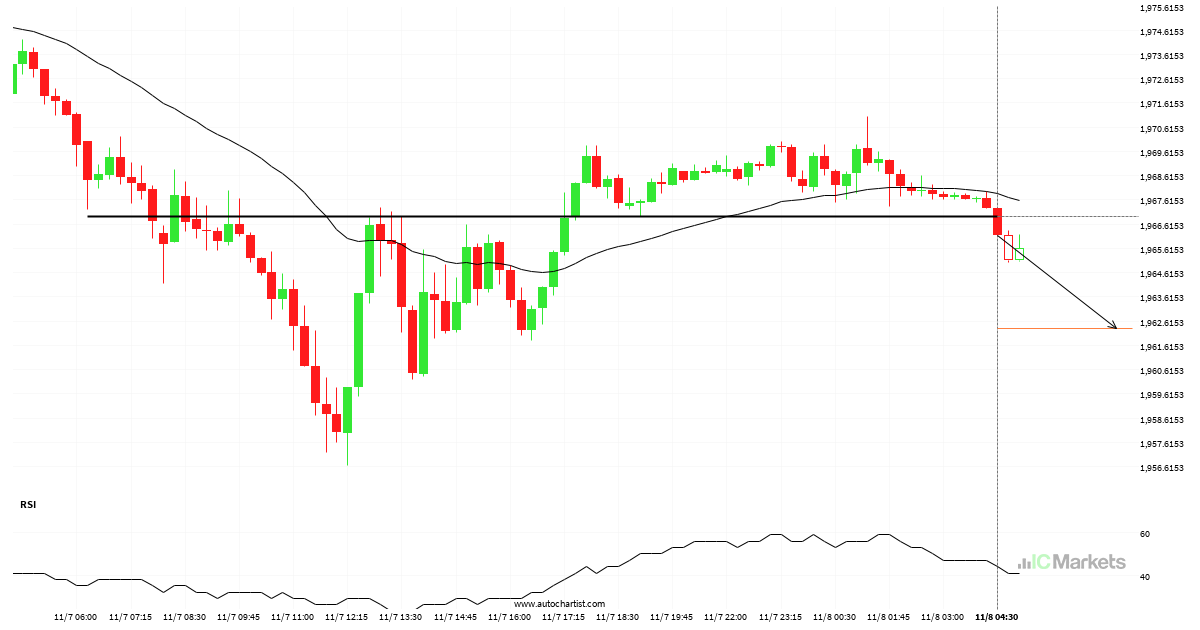
Confirmed breakout on GOLD 15 Minutes chart
GOLD has broken through a support line. Because we have seen it retrace from this price in the past, one should wait for confirmation of the breakout before trading. It has touched this line numerous times in the last 22 hours and suggests a possible target level to be around 1962.3110 within the next 5 […]

Possible breach of support level by SILVER
An emerging Triangle has been detected on SILVER on the 4 hour chart. There is a possible move towards 22.6490 next few candles. Once reaching resistance it may continue its bearish run or reverse back to current price levels.